
Barcelona Big Data Week
Des del grup d’usuaris de R de Barcelona participem activament a la Barcelona Big Data Week.
Durant aquesta setmana es realitzaran les següents sessions:
Més informació a la web de la Big Data Week i als esdeveniments del meetup.
![]()
Comparteix

Anaconda for R users + applications of text mining
Aquest dijous 29 d’octubre de 2015 tenim una nova sessió del grup d’usuaris d’R de Barcelona.
Les dues xerrades programades són les següents:
- Anaconda for R users per Christine Doig.
- Text mining with R in business context per Rafal Szota, Guillem Solà i Ferran Gomis.
Per apuntar-vos a la sessió i més informació aneu al meetup de l’event.
Comparteix

Oferta BI Analyst para Sector Bancario/Financiero
Filial de importante empresa del sector bancario ubicada en Barcelona precisa incorporar un Business Intelligence Analyst. Su misión será dar soporte necesario para llevar a cabo acciones comerciales y satisfacer las peticiones de información de las áreas de negocio, analizar esta información y generar conclusiones para ayudar a la toma de decisiones reportando el Director de BI.
Funciones:
- Resolver análisis concretos y definidos de información. Tratar la información (agregar, fusionar, calcular indicadores,…), analizarla y extraer resultados y conclusiones. Preparar resúmenes e informes de resultados.
- Participar en análisis para la elaboración de estudios orientados a la toma de decisiones.
- Acceder, y tratar la información para seleccionar públicos objetivo de clientes en acciones comerciales o de mejora de la rentabilidad y realizar seguimientos de estas acciones comerciales.
- Dar soporte a las peticiones de información de las distintas áreas, formación a las áreas de soporte en las herramientas de análisis y ayuda en procesos operativos de prueba de nuevas acciones comerciales.
- Responsabilizarse de los procesos de automatización de acciones recurrentes y participar en el mantenimiento funcional de la BBDD.
- Proponer mejoras tanto de herramientas, como de procesos de análisis, como de monetización de la información disponible.
- Utilizando las herramientas disponibles y persiguiendo los objetivos de negocio definidos.
Requisitos:
- Formación: Informática, Estadística, Matemáticas, investigación de Mercados etc.
- Formación complementaria: Se valorará master en BI y conocimientos de negocio MK.
- Idiomas: Inglés nivel alto, y Castellano.
- Conocimientos específicos: BBDD, estadísticas, datamining, SAS Microstrategy, SQL,..
- Experiencia: 2 años en consultoría o empresa en funciones de BI.
Link Posición: http://bit.ly/1NO2Boh
Contacto: Laura Martín, Consultora laura@smart-selection.com
Comparteix
Text Mining amb R i presentacions de 2015
El pròxim 1 d’octubre de 2015, la Laura Marquès farà una introducció a Text Mining amb R. Es presentaran els packages twitter, tm i wordcloud.
La reunió es farà a les oficines de King a Barcelona, Avinguda Josep Tarradelles 123, planta 6.
Per apuntar-vos i informació més detallada aneu al meetup de l’event.
Des que vam començar el 2011, tenim les presentacions i xerrades realitzades al grup dispersades entre el blog i el meetup. He pensat compilar les xerrades i presentacions que s’han generat al llarg del temps al grup. He creat una pàgina que reculli totes les presentacions a un mateix lloc.
De moment, aquí teniu el llistat de què s’ha realitzat el 2015 i la setmana que ve, afegiré la de la Laura.
- Taller de crear packages, per Lluís Ramon i Aleix Ruiz de Villa, Slides, Codi
- Investigar las tarjetas black con dplyr per François Delaunay, Presentación
- Automatic Reporting with rmarkdown per Lluís Ramon i Carlos Bort, Slides, Codi
- ggpot2 the easiest path to graphics per Jordi Puigdellivol, Slides
A la pàgina del bloc de moment només hi ha el 2015, els anys anteriors els aniré afegint a poc a poc, a veure si és fàcil compilar-ho tot.

Comparteix

New Version of RStudio (v0.99) Available Now
We’re pleased to announce that the final version of RStudio v0.99 is available for download now. Highlights of the release include:
- A new data viewer with support for large datasets, filtering, searching, and sorting.
- Complete overhaul of R code completion with many new features and capabilities.
- The source editor now provides code diagnostics (errors, warnings, etc.) as you work.
- User customizable code snippets for automating common editing tasks.
- Tools for Rcpp: completion, diagnostics, code navigation, find usages, and automatic indentation.
- Many additional source editor improvements including multiple cursors, tab re-ordering, and several new themes.
- An enhanced Vim mode with visual block selection, macros, marks, and subset of : commands.
There are also lots of smaller improvements and bug fixes across the product. Check out the v0.99 release notes for details on all of the changes.
Data Viewer
We’ve completely overhauled the data viewer with many new capabilities including live update, sorting…
View original post 328 more words
Comparteix
Data Visualization cheatsheet, plus Spanish translations
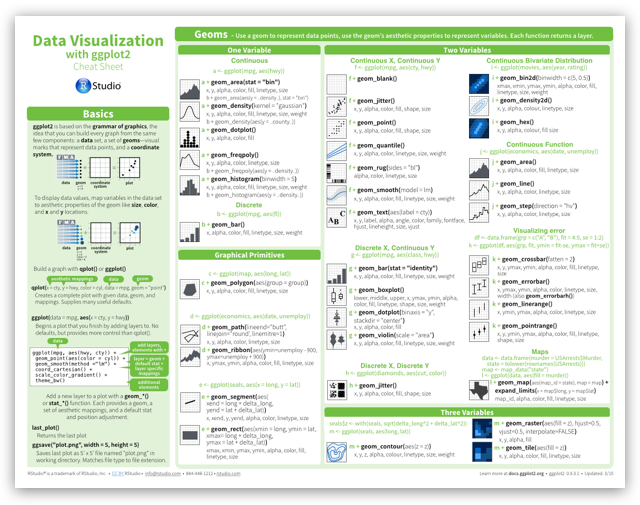
We’ve added a new cheatsheet to our collection. Data Visualization with ggplot2 describes how to build a plot with ggplot2 and the grammar of graphics. You will find helpful reminders of how to use:
- geoms
- stats
- scales
- coordinate systems
- facets
- position adjustments
- legends, and
- themes
The cheatsheet also documents tips on zooming.
Download the cheatsheet here.
Bonus – Frans van Dunné of Innovate Online has provided Spanish translations of the Data Wrangling, R Markdown, Shiny, and Package Development cheatsheets. Download them at the bottom of the cheatsheet gallery.
Comparteix
About Visualization – comments on the last Barcelona R User Group Meetup at itnig
Fruit de la col·laboració d’itnig amb el grup d’usuaris d’R, ens van demanar si podríem escriure al seu bloc sobre el grup i com havia anat la reunió de la setmana passada sobre ggplot2. Vam decidir que seria una entrada conjunta al bloc d’itnig i al de rugbcn.
A continuació, el text complet on explico en anglès què és R, de què va el grup d’usuaris d’R de Barcelona i sobre la reunió de dimecres passat.
Last Wednesday took place a regular meeting of the Barcelona R user group community at itnig. This time, the topic was visualization and the talk was given by Jordi Puigdellivol, Data Scientist at AIA.
First things first, what is R?
R is a domain specific programming language that provides a wide variety of statistical, graphical, data manipulation, data modeling, reporting and machine learning techniques that has become an essential tool for Data Scientist at businesses, public administration and academia.
R is open source and is highly extensible, with more than 6000 packages at the Comprehensive R Archive Network (CRAN), and this number is increasing every day. Companies like Facebook, Google, Microsoft and twitter use R for they data analysis day to day work and have done several contributions to the R project.
For some fancy video explaining how cool R is in the Data Analysis world, you can watch this promotional video: R: The most powerful and most widely used statistical software
Right now, there are many online resources where you can learn R. The Try R Course at CodeSchool or the Statistical Learning Course at Stanford University are some of them. You could also join the R User Group Barcelona (RUGBCN) and learn in person with other R users and share your doubts and/or your expertise.
As I was saying, last week week it took place one of our in person meetings, where Jordi Puigdellivol talked about ggplot2. It is an implementation of the grammar of graphics in R. It combines a powerful theory to build any plot you can think about in a easy and nice way. Jordi made an exploratory analysis with fake Facebook data and diamonds data using ggplot2 to get some insights and show how to use ggplot2 package. As always, an important part of the meeting was networking and sharing our expertise about R, data analysis and some statistical and machine learning ideas. You can see Jordi’s presentation with a lot of examples and you could also visit the ggplot2 website for more information, documentation and examples.
What is RUGBCN about?
Barcelona R user group (RUGBCN) is an open R user community for the Barcelona area. Both online and in person at regular meetings, we aim to provide community support to Barcelona R users, facilitate collaborations, share tips, tricks and ideas, provide presentations on R projects and workshops on R topics or packages. The group is multilingual, informal and professional. All levels of R-saaviness are welcome. Meetings are scheduled through meetup and are held at itnig. Several companies value what we do and sponsor our meetings. We are very grateful to itnig, Estrella Damm,Revolutions Analytics and O’Reilly Media for their support.
This post was also published at itnig blog.

Comparteix

Revolution Analytics Sponsorship 2015
![]()
Benvingut sigui a la comunitat Revolution Analytics i el seu R User Group 2015 Sponsorship program! Des de RUGBCN ens alegrem de que tindrem aquest nou sponsor el 2015!
De moment ens servirà per pagar les despeses que ens genera estar a la plataforma meetup, que ens va molt bé per organitzar les reunions. Les samarretes, stickers i el que enviin les anirem sortejant a les reunions i les regalarem als ponents.
Es adient recordar que el grup d’usuaris de Barcelona va sorgir del blog de Revolution Analytics a l’apartat de grups locals. Als comentaris el Tim proposava si algú voldria formar un grup d’usuaris d’R a Barcelona cap allà el 2010.
Aprofitem per agrair als altres sponsors com itnig, Estrella Damm i O’Reilly Media. Si voleu sponsoritzar o realitzar alguna col·laboració amb el grup d’usuaris d’R contacteu amb l’Aleix Ruiz de Villa o amb Lluís Ramon.
Comparteix
tidyr 0.2.0 (and reshape2 1.4.1)
tidyr 0.2.0 is now available on CRAN. tidyr makes it easy to “tidy” your data, storing it in a consistent form so that it’s easy to manipulate, visualise and model. Tidy data has variables in columns and observations in rows, and is described in more detail in the tidy data vignette. Install tidyr with:
install.packages("tidyr")There are three important additions to tidyr 0.2.0:
expand()is a wrapper aroundexpand.grid()that allows you to generate all possible combinations of two or more variables. In conjunction withdplyr::left_join(), this makes it easy to fill in missing rows of data.sales <- dplyr::data_frame( year = rep(c(2012, 2013), c(4, 2)), quarter = c(1, 2, 3, 4, 2, 3), sales = sample(6) * 100 ) # Missing sales data for 2013 Q1 & Q4 sales #> Source: local data frame [6 x 3] #> #> year quarter sales #> 1 2012 1 400 #>…
View original post 480 more words
Comparteix
O’Reilly Media sponsorship
We have a new sponsor. O’Reilly Media provides
- Books
- Conference discounts: using UGRugBcn20 (http://oreil.ly/UGSEU14)
- Strata Conference ticket
More information to come.

Aleix, RugBcn
Comparteix

Sponsors


